311. Neural Network Visualization
Use Matplotlib to see what's going on in an autoencoder
You can enroll below for free or, if it's easier, unlock the entire End-to-End Machine Learning Course Catalog for 20 USD.
In this Building Blocks course we'll build a custom visualization of an autoencoder neural network using Matplotlib. The course is divided up into 33 small coding exercises, making it a step-by-step experience.
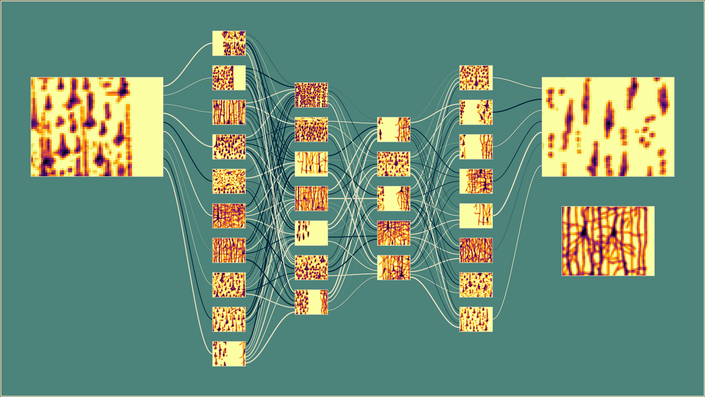
When we're done you'll have the python code to create and render this:

In addition to confidently navigating Matplotlib, the visualization code can come in handy if you ever decide to experiment with building neural networks of your own.
Course Curriculum
-
PreviewCode up the constants
-
PreviewBuild a parameter dictionary I: Figure (3:14)
-
PreviewBuild parameter dictionary II: Input (1:26)
-
PreviewBuild parameter dictionary III: Layers (2:52)
-
PreviewBuild parameter dictionary IV: Error image (1:21)
-
PreviewCreate the Figure (3:19)
-
PreviewSet Figure colors (5:16)
-
PreviewSet Figure resolution (2:37)
Your Instructor

I love solving puzzles and building things. Machine learning lets me do both. I got started by studying robotics and human rehabilitation at MIT (MS '99, PhD '02), moved on to machine vision and machine learning at Sandia National Laboratories, then to predictive modeling of agriculture DuPont Pioneer, and cloud data science at Microsoft. At Facebook I worked to get internet and electrical power to those in the world who don't have it, using deep learning and satellite imagery and to do a better job identifying topics reliably in unstructured text. Now at iRobot I work to help robots get better and better at doing their jobs. In my spare time I like to rock climb, write robot learning algorithms, and go on walks with my wife and our dog, Reign of Terror.